How do you show off your digital prowess?
Using 4D animation for scheduling
When it comes to data and digitisation, 4D animations add time to 3D models. This allows creating construction schedules and project plans. They create an immersive project approach and literally bring the project to life through visualisation and animations.
For winning work, they’re an excellent way for clients to experience their site in a timed context. That is to say, they have more clarity and understanding of their project before they ever get to the site.
In addition, it also helps contractors to understand the buildability of the proposed approach and sequencing. In other words, you can try out different scenarios in a safe, cost-free environment.
Scenario testing allows you to:
- gain more understanding of the project
- decide the best build methodology for the client’s requirements
- demonstrate and explain your decision making process in a more engaging and interactive manner
Using and investing in 4D animations also shows you care. You’re investing time and energy into the project at the outset. It sets a higher level of quality and expectation of the level of service you will provide.
Digital workflows and processes
Digitising workflows and processes is ultimately digitising your project team.
Demonstrating what areas you have already digitised but being honest about what hasn’t yet been digitised can show you have a level of digital maturity and aren’t just innovation washing.
A roadmap and explanation of a few potential digital pilots on your client’s site are also sure to excite them.
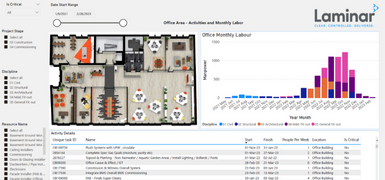
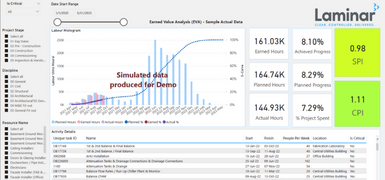
Interactive reports so you can get to the heart of your project
Imagine how your decision making could improve if you had real-time data and visualisations at your fingertips. You can achieve this with digitisation and dashboards done correctly.
You can look at your project from a macro project perspective or drill down to a specific package of works, discipline and even right down to who is accountable for the information you’re viewing. These interactive reports are based on actual costs, real resources, and your site’s real current constraints.
How to get started with data and digitisation?
To make data visualisation and data-driven decision-making work properly, you need to set things up right from the start. Companies are sitting on a mountain of data and drowning in a sea of pie charts and visuals that just aren’t useful.
To get the most out of data visualisation and data-based decision-making, contractors and clients must set up their data protocols, systems, and processes according to their own overall business or project objectives.
Therefore, you need to work with people who really understand data and visualisation and know about construction, namely, what happens when building on-site starts.
The objectives and outcomes must reflect the project—everything from its unique characteristics and outcomes site-based to supply chain and resource variables. The digital dashboards and reports should be set up to be understandable and also help to aid rapid decision making.
In conclusion, contractors who use data and decision making at the bid stage can use the points identified to boost competitive advantage and mitigate project risks through a greater understanding of what’s to come.
You can read part I of this article here and check out our Data & Digital section to learn more about how we’re helping our Clients with the digitisation of their projects.